ggplot2之主题设置#
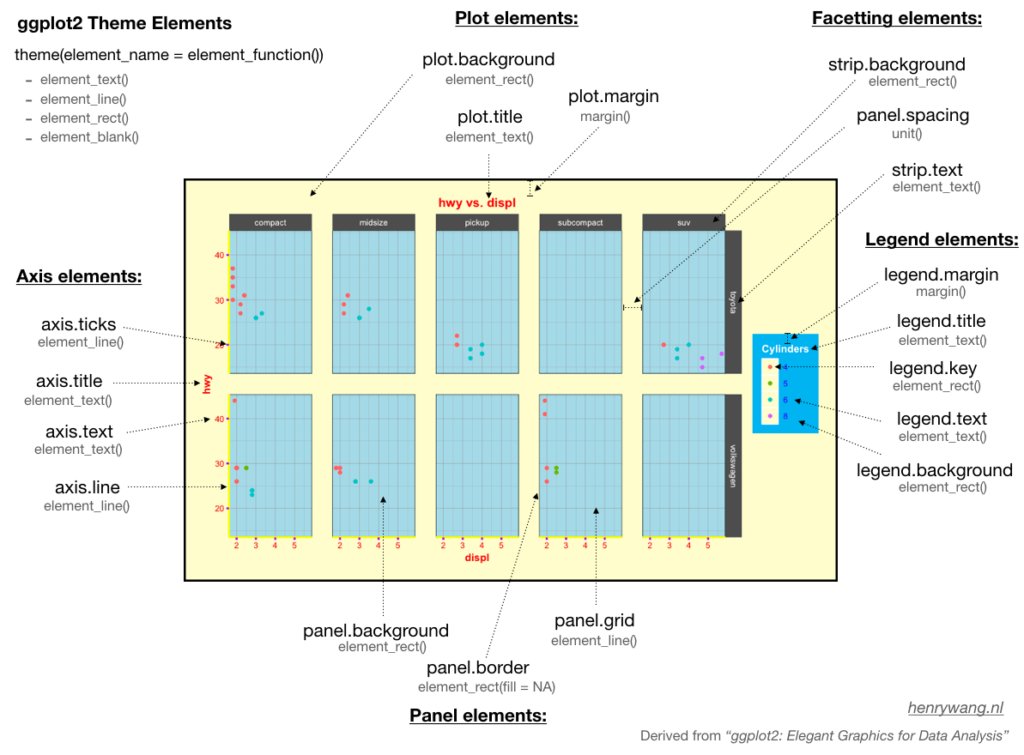
ggplot2中的theme elements 语法
theme(element_name = element_function())
Error in theme(element_name = element_function()): 没有"theme"这个函数
Traceback:
这里element_function()有四个
element_text(), 文本,一般用于控制标签和标题的字体风格element_line(), 线条,一般用于控制线条或线段的颜色或线条类型element_rect(), 矩形区域,一般用于控制背景矩形的颜色或者边界线条类型element_blank(), 空白,就是不分配相应的绘图空间,即删去这个地方的绘图元素。
library(tidyverse)
── Attaching core tidyverse packages ───────────────────────────────────────────────────────────────────────────────────────────────────────────────────────── tidyverse 2.0.0 ──
✔ dplyr     1.1.4     ✔ readr     2.1.5
✔ forcats   1.0.0     ✔ stringr   1.5.1
✔ ggplot2   3.5.0     ✔ tibble    3.2.1
✔ lubridate 1.9.3     ✔ tidyr     1.3.1
✔ purrr     1.0.2
── Conflicts ─────────────────────────────────────────────────────────────────────────────────────────────────────────────────────────────────────────── tidyverse_conflicts() ──
✖ dplyr::filter() masks stats::filter()
✖ dplyr::lag()    masks stats::lag()
ℹ Use the conflicted package (<http://conflicted.r-lib.org/>) to force all conflicts to become errors
glimpse(mpg)
Rows: 234
Columns: 11
$ manufacturer <chr> "audi", "audi", "audi", "audi", "audi", "audi", "audi", "…
$ model        <chr> "a4", "a4", "a4", "a4", "a4", "a4", "a4", "a4 quattro", "…
$ displ        <dbl> 1.8, 1.8, 2.0, 2.0, 2.8, 2.8, 3.1, 1.8, 1.8, 2.0, 2.0, 2.…
$ year         <int> 1999, 1999, 2008, 2008, 1999, 1999, 2008, 1999, 1999, 200…
$ cyl          <int> 4, 4, 4, 4, 6, 6, 6, 4, 4, 4, 4, 6, 6, 6, 6, 6, 6, 8, 8, …
$ trans        <chr> "auto(l5)", "manual(m5)", "manual(m6)", "auto(av)", "auto…
$ drv          <chr> "f", "f", "f", "f", "f", "f", "f", "4", "4", "4", "4", "4…
$ cty          <int> 18, 21, 20, 21, 16, 18, 18, 18, 16, 20, 19, 15, 17, 17, 1…
$ hwy          <int> 29, 29, 31, 30, 26, 26, 27, 26, 25, 28, 27, 25, 25, 25, 2…
$ fl           <chr> "p", "p", "p", "p", "p", "p", "p", "p", "p", "p", "p", "p…
$ class        <chr> "compact", "compact", "compact", "compact", "compact", "c…
df <- mpg %>%
  as_tibble() %>%
  filter(class != "2seater", manufacturer %in% c("toyota", "volkswagen"))
df %>% head()
| manufacturer | model | displ | year | cyl | trans | drv | cty | hwy | fl | class |
|---|---|---|---|---|---|---|---|---|---|---|
| <chr> | <chr> | <dbl> | <int> | <int> | <chr> | <chr> | <int> | <int> | <chr> | <chr> |
| toyota | 4runner 4wd | 2.7 | 1999 | 4 | manual(m5) | 4 | 15 | 20 | r | suv |
| toyota | 4runner 4wd | 2.7 | 1999 | 4 | auto(l4) | 4 | 16 | 20 | r | suv |
| toyota | 4runner 4wd | 3.4 | 1999 | 6 | auto(l4) | 4 | 15 | 19 | r | suv |
| toyota | 4runner 4wd | 3.4 | 1999 | 6 | manual(m5) | 4 | 15 | 17 | r | suv |
| toyota | 4runner 4wd | 4.0 | 2008 | 6 | auto(l5) | 4 | 16 | 20 | r | suv |
| toyota | 4runner 4wd | 4.7 | 2008 | 8 | auto(l5) | 4 | 14 | 17 | r | suv |
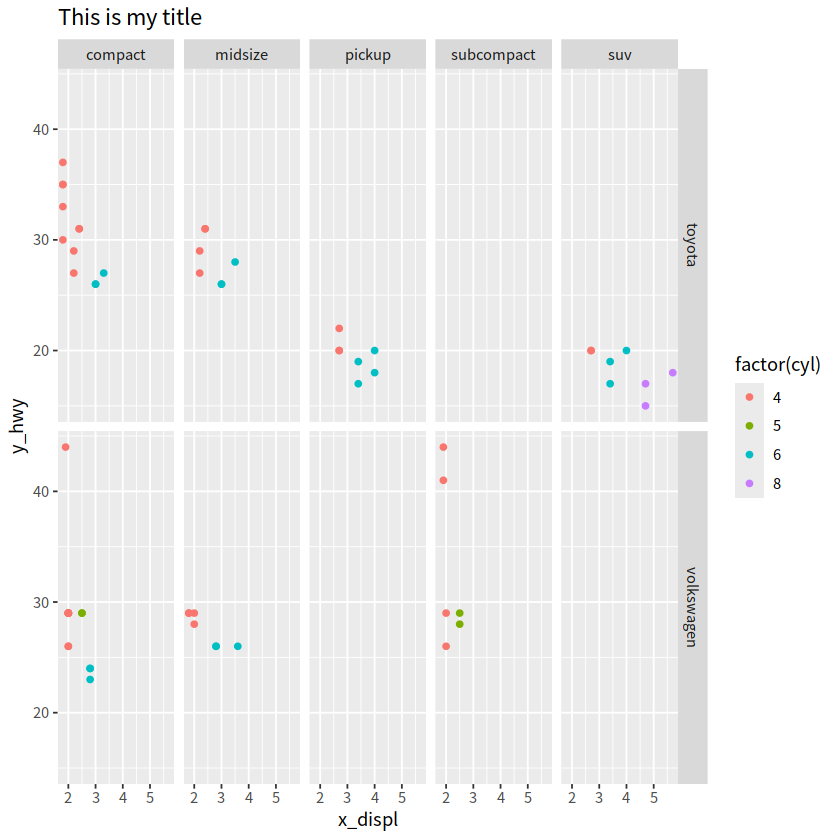
df %>%
  ggplot(aes(x = displ, y = hwy, color = factor(cyl)))+
  geom_point()+
  facet_grid(vars(manufacturer), vars(class))+
  ggtitle("This is my title")+
  labs(x = "x_displ", y = "y_hwy")
1 图表整体元素#
图表整体元素包括:
描述 |
主题元素 |
类型 |
|---|---|---|
整个图形背景 |
plot.background |
element_rect() |
图形标题 |
plot.title |
element_text() |
图形边距 |
plot.margin |
margin() |
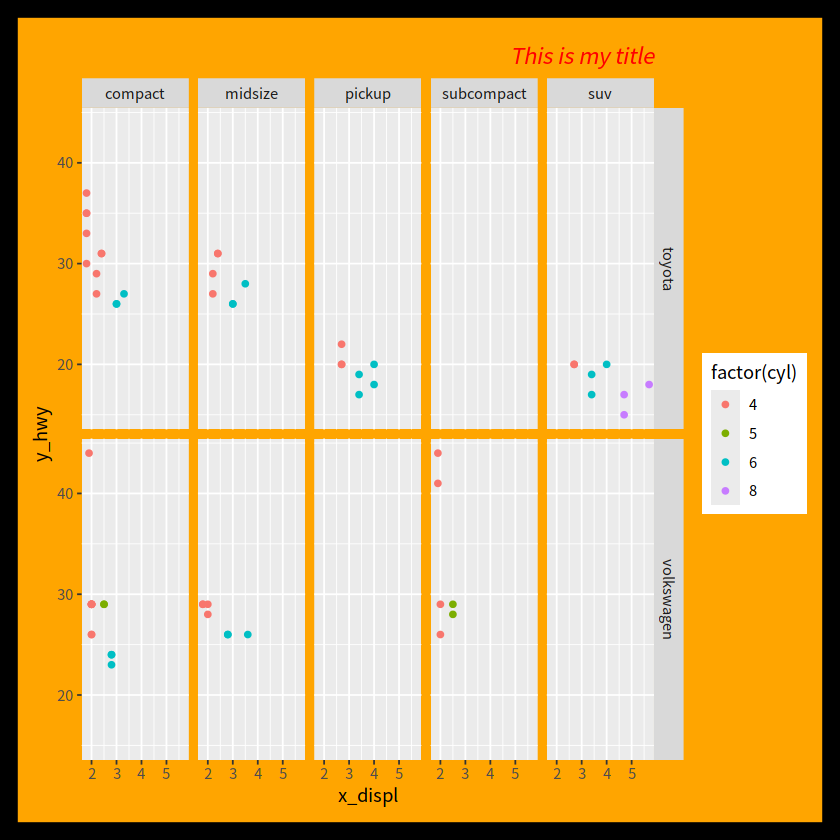
df %>%
  ggplot(aes(x = displ, y = hwy, color = factor(cyl)))+
  geom_point()+
  facet_grid(vars(manufacturer), vars(class))+
  ggtitle("This is my title")+
  labs(x = "x_displ", y = "y_hwy")+
  theme(plot.background = element_rect(fill = "orange", color = "black", size = 10),
        plot.title = element_text(hjust = 1, color = "red", face = "italic"),
        plot.margin = margin(t = 29, r = 20, b = 20, l = 20, unit = "pt"))
Warning message:
“The `size` argument of `element_rect()` is deprecated as of ggplot2 3.4.0.
ℹ Please use the `linewidth` argument instead.”
2 坐标轴元素#
坐标轴元素包括:
描述 |
主题元素 |
类型 |
|---|---|---|
坐标轴刻度 |
axis.ticks |
element_line() |
坐标轴标题 |
axis.title |
element_text() |
坐标轴标签 |
axis.text |
element_text() |
直线和坐标轴 |
axis.line |
element_line() |
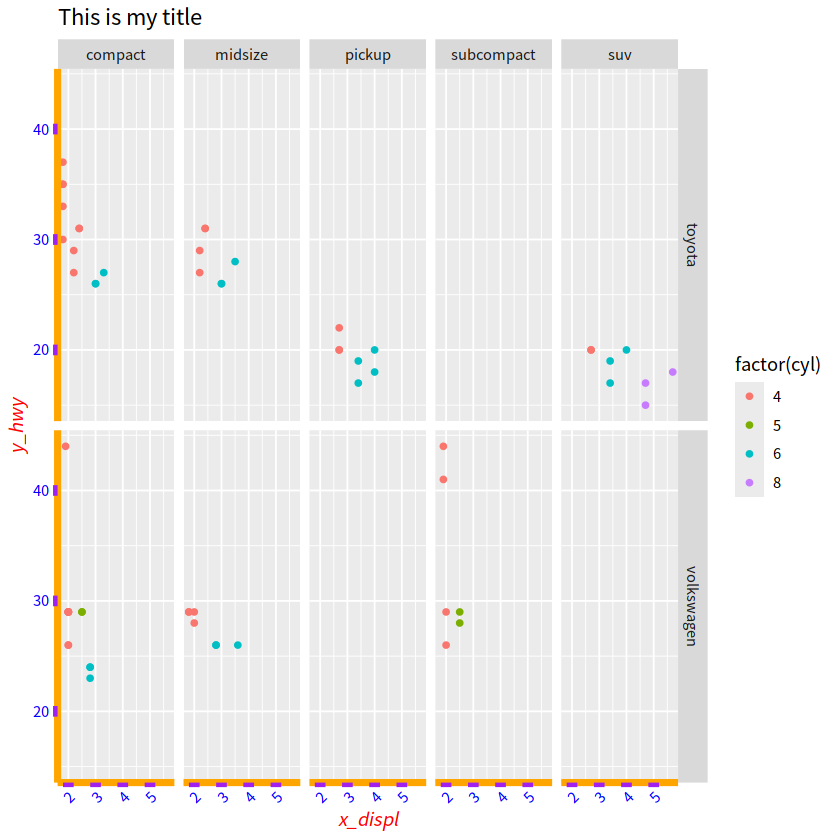
df %>%
  ggplot(aes(x = displ, y = hwy, color = factor(cyl)))+
  geom_point()+
  facet_grid(vars(manufacturer), vars(class))+
  ggtitle("This is my title")+
  labs(x = "x_displ", y = "y_hwy")+
  theme(axis.line = element_line(color = "orange", size = 2),
        axis.title = element_text(color = "red", face = "italic"),
        axis.ticks = element_line(color = "purple", size = 3),
        axis.text = element_text(color = "blue"),
        axis.text.x = element_text(angle = 45, hjust = 1))
Warning message:
“The `size` argument of `element_line()` is deprecated as of ggplot2 3.4.0.
ℹ Please use the `linewidth` argument instead.”
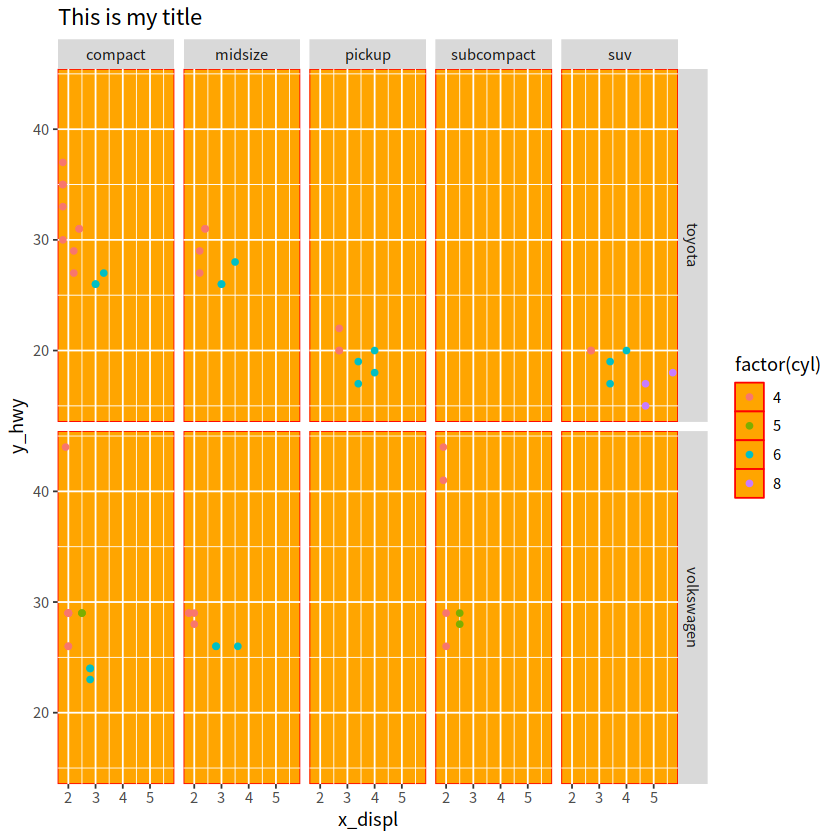
3 面板元素#
注意!!!这与背景是有区别的
面板元素包括:
描述 |
主题元素 |
类型 |
|---|---|---|
面板背景 |
panel.background |
element_rect() |
面板网格线 |
panel.grid |
element_line() |
面板边界 |
panel.border |
element_rect() |
df %>%
  ggplot(aes(x = displ, y = hwy, color = factor(cyl))) +
  geom_point() +
  facet_grid(vars(manufacturer), vars(class)) +
  ggtitle("This is my title") +
  labs(x = "x_displ", y = "y_hwy") +
  theme(panel.background = element_rect(fill = "orange", color = "red"),
        panel.grid = element_line(color = "white", size = 0.5))
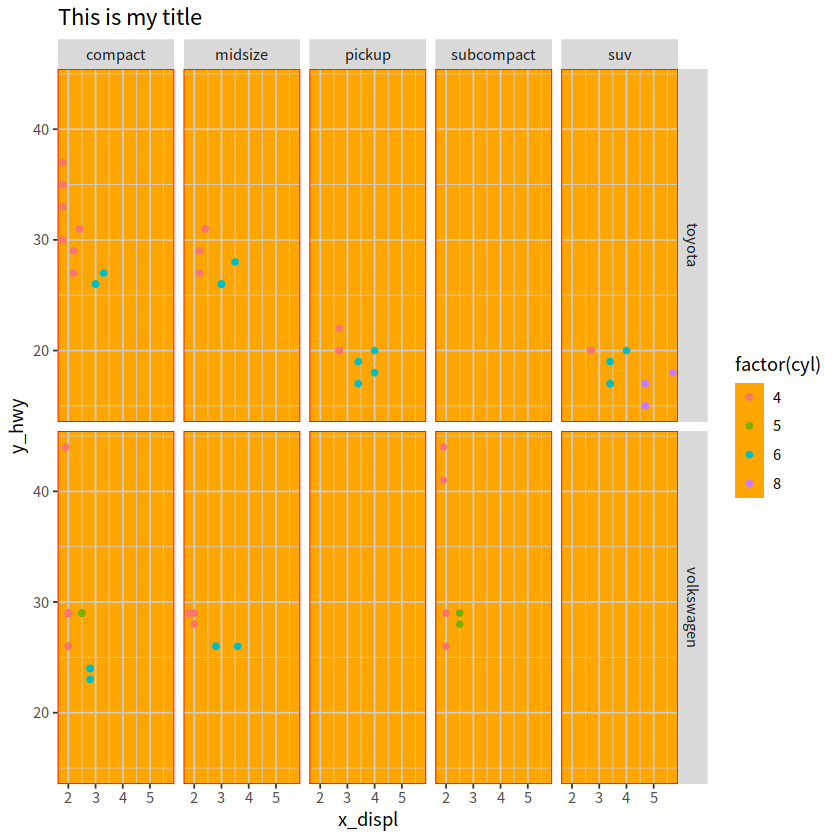
或者
df %>%
  ggplot(aes(x = displ, y = hwy, color = factor(cyl))) +
  geom_point() +
  facet_grid(vars(manufacturer), vars(class)) +
  ggtitle("This is my title") +
  labs(x = "x_displ", y = "y_hwy") +
  theme(
    panel.background = element_rect(fill = "orange"),
    panel.grid = element_line(color = "grey80", size = 0.5),
    panel.border = element_rect(color = "red", fill = NA)
  )
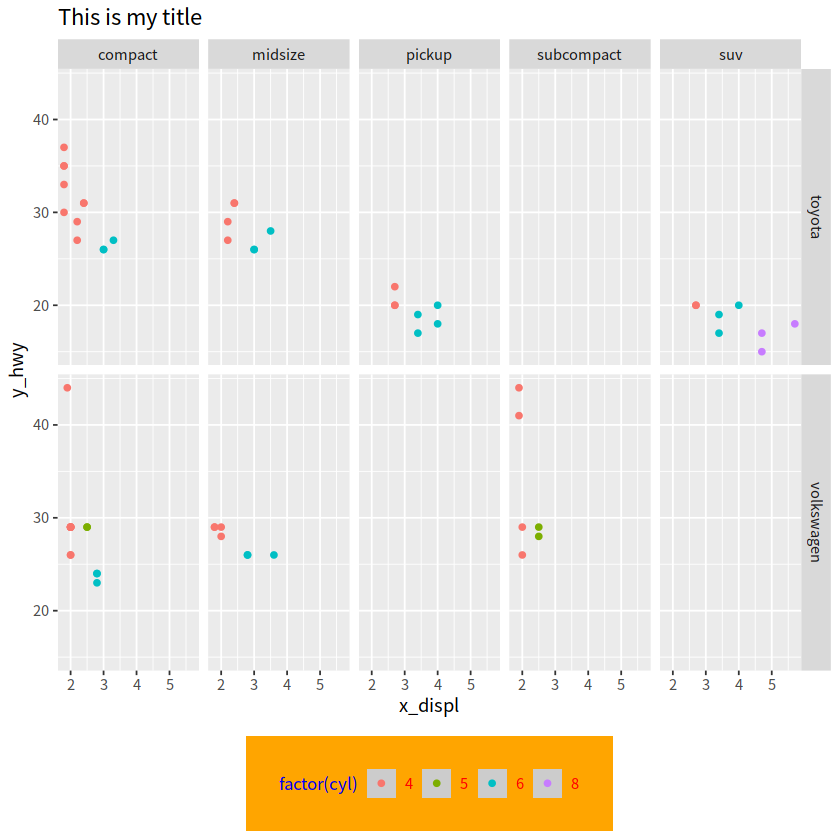
4 图例元素#
图例元素包括:
描述 |
主题元素 |
类型 |
|---|---|---|
图例背景 |
legend.background |
element_rect() |
图例符号 |
legend.key |
element_rect() |
图例标签 |
legend.text |
element_text() |
图例标题 |
legend.title |
element_text() |
图例边距 |
legend.margin |
margin |
图例位置 |
legend.postion |
“top”, “bottom”, “left”, “right” |
df %>%
  ggplot(aes(x = displ, y = hwy, color = factor(cyl))) +
  geom_point() +
  facet_grid(vars(manufacturer), vars(class)) +
  ggtitle("This is my title") +
  labs(x = "x_displ", y = "y_hwy") +
  theme(legend.background = element_rect(fill = "orange"),
        legend.title = element_text(color = "blue", size = 10),
        legend.key = element_rect(fill = "grey80"),
        legend.text = element_text(color = "red"),
        legend.margin = margin(t = 20, r = 20, b = 20, l = 20, unit = "pt"),
        legend.position = "bottom")
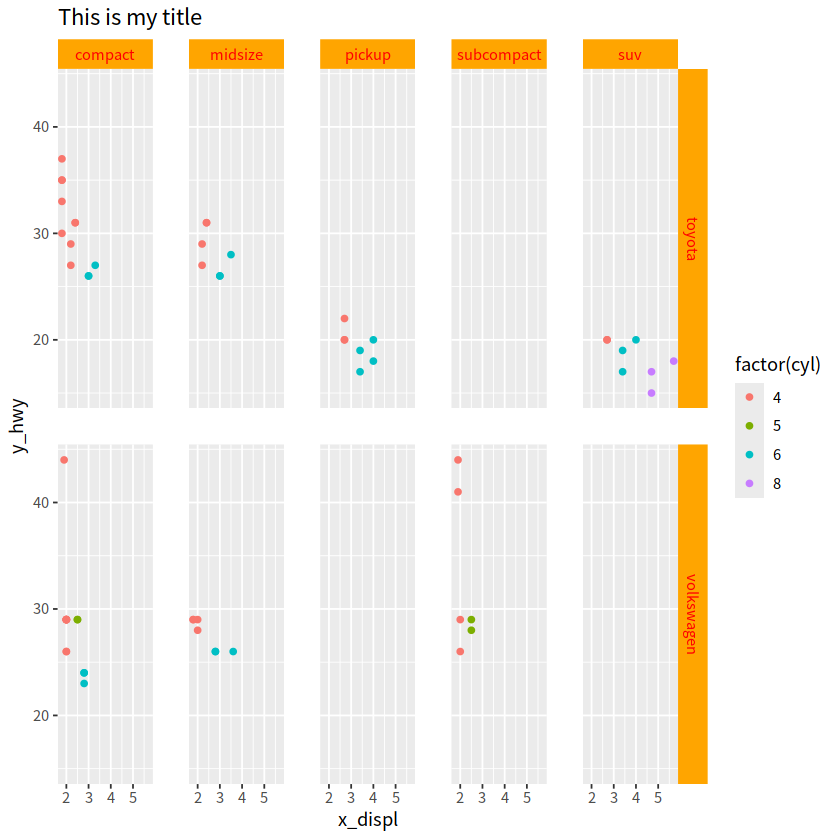
5 分面元素#
分面元素包括:
描述 |
主题元素 |
类型 |
|---|---|---|
分面标签背景 |
strip.background |
element_rect() |
条状文本 |
strip.text |
element_text() |
分面间隔 |
panel.spacing |
unit |
df %>%
  ggplot(aes(x = displ, y = hwy, color = factor(cyl))) +
  geom_point() +
  facet_grid(vars(manufacturer), vars(class)) +
  ggtitle("This is my title") +
  labs(x = "x_displ", y = "y_hwy") +
  theme(strip.background = element_rect(fill = "orange"),
        strip.text = element_text(color = "red"),
        panel.spacing = unit(0.3, "inch"))
6 案例#
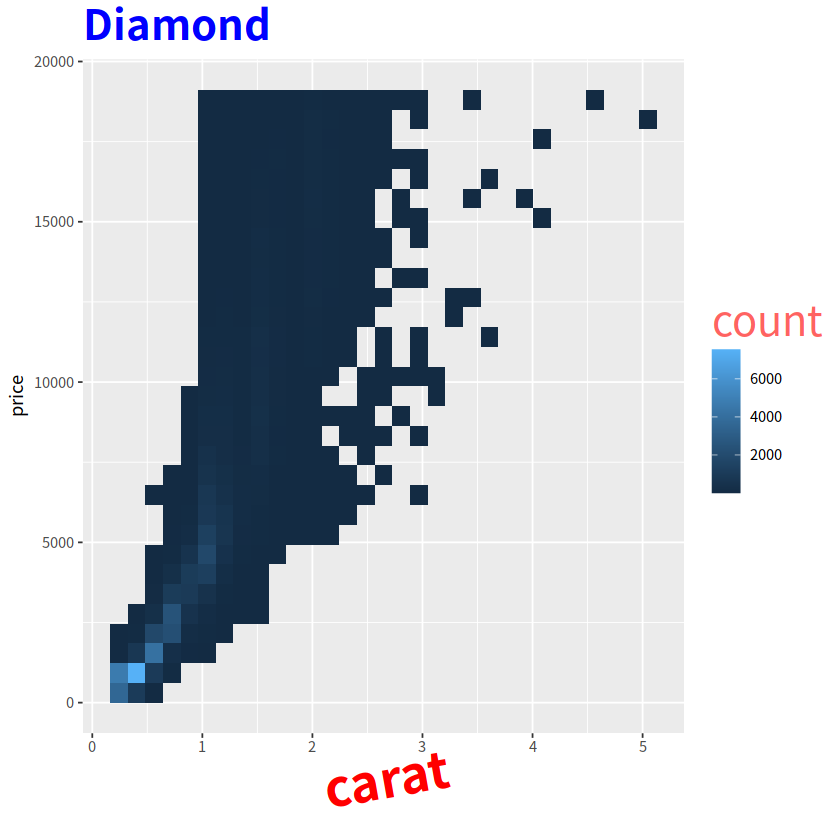
diamonds %>%
  ggplot(aes(carat, price))+
  geom_bin_2d()+
  labs(title = "Diamond")+
  theme(axis.title.x = element_text(size = 30, color = "red",
                                    face = "bold", angle = 10),
        legend.title = element_text(size = 25, color = "#ff6361",
                                    margin = margin(b = 5)),
        plot.title = element_text(size = 25, face = "bold", color = "blue"))
library(palmerpenguins)
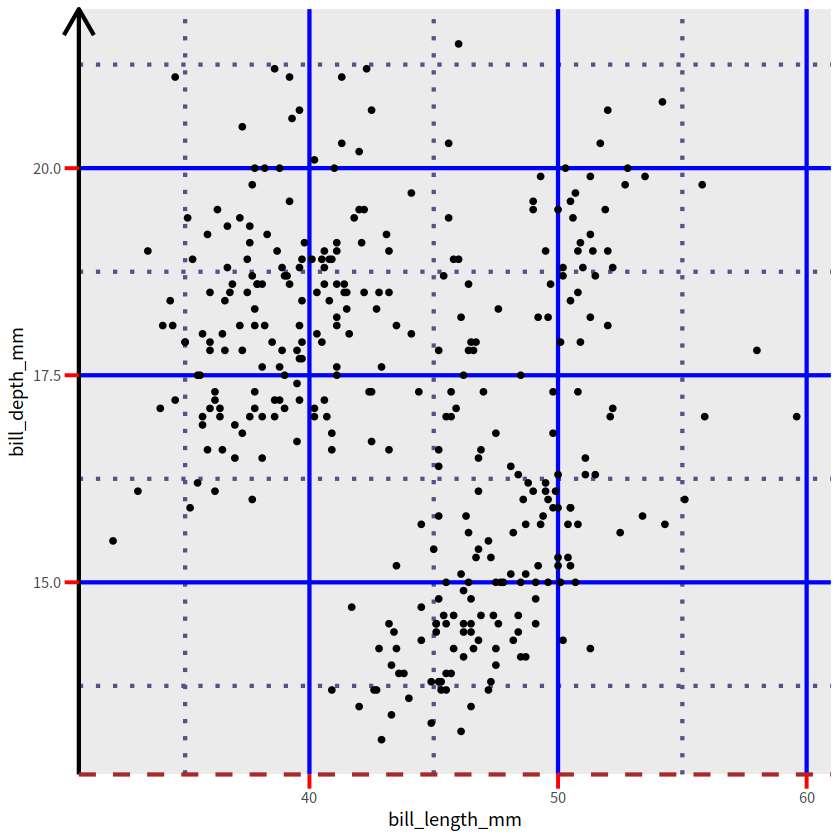
penguins %>%
ggplot(aes(bill_length_mm, bill_depth_mm))+
geom_point()+
theme(axis.line.y = element_line(color = "black", size = 1.2,
arrow = grid::arrow()),
axis.line.x = element_line(color = "brown", size = 1.2,
linetype = "dashed"),
axis.ticks = element_line(color = "red", size = 1.1),
axis.ticks.length = unit(3, "mm"),
panel.grid.minor = element_line(color = "#58508d", size = 1.2,
linetype = "dotted"),
panel.grid.major = element_line(color = "blue", size = 1.2))
Warning message:
“Removed 2 rows containing missing values or values outside the scale range (`geom_point()`).”
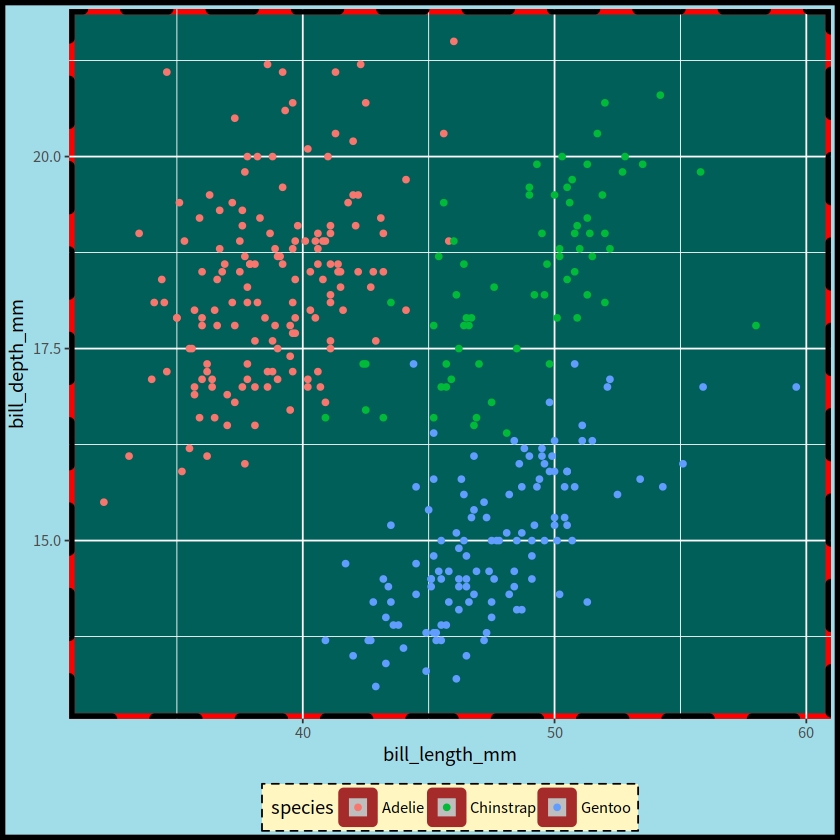
penguins %>%
  ggplot(aes(bill_length_mm, bill_depth_mm)) +
  geom_point(aes(color = species)) +
  theme(legend.background = element_rect(fill = "#fff6c2", color = "black",
                                         linetype = "dashed"),
        legend.key = element_rect(fill = "grey", color = "brown"),
        panel.background = element_rect(fill = "#005F59", color = "red",
                                        size = 3),
        panel.border = element_rect(color = "black", fill = "transparent",
                                    linetype = "dashed", size = 3),
        plot.background = element_rect(fill = "#a1dce9", color = "black",
                                       size = 3),
        legend.position = "bottom")
Warning message:
“Removed 2 rows containing missing values or values outside the scale range (`geom_point()`).”
7 小结#
8 主题风格#
当然可以使用自带的主题风格
ggplot有很多自带的theme,其拓展包ggthemes增加了更多的theme
thms <- list.files(path = "imags/img", pattern = "built-in", full.names = T)
knitr::include_graphics(thms)
character(0)
attr(,"class")
[1] "knit_image_paths" "knit_asis"
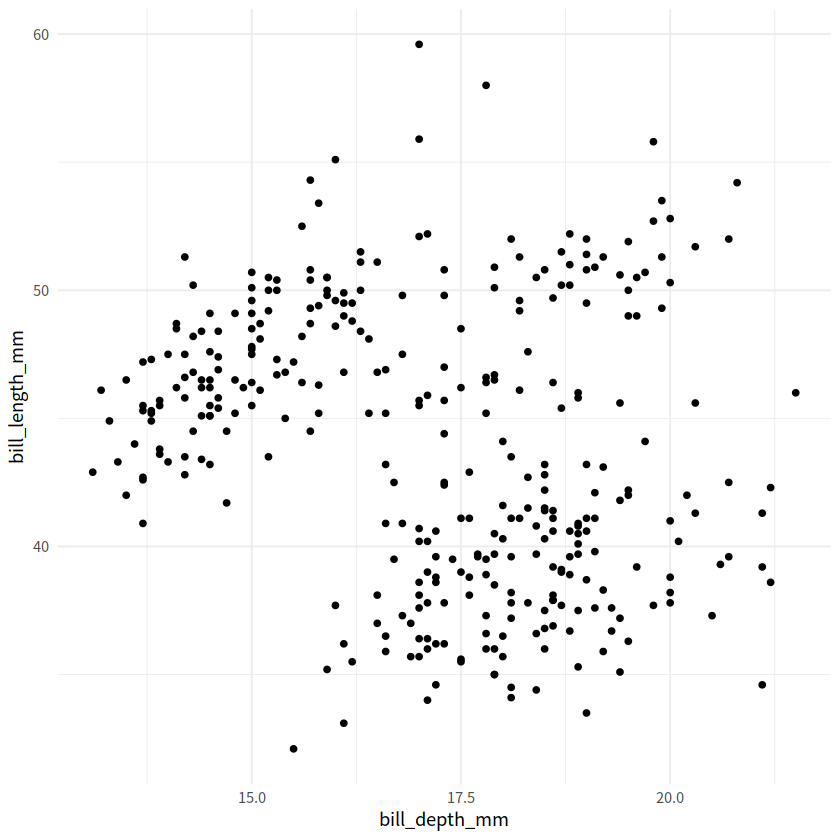
penguins %>%
  ggplot(aes(x = bill_depth_mm, y = bill_length_mm))+
  geom_point()+
  theme_minimal()
Warning message:
“Removed 2 rows containing missing values or values outside the scale range (`geom_point()`).”
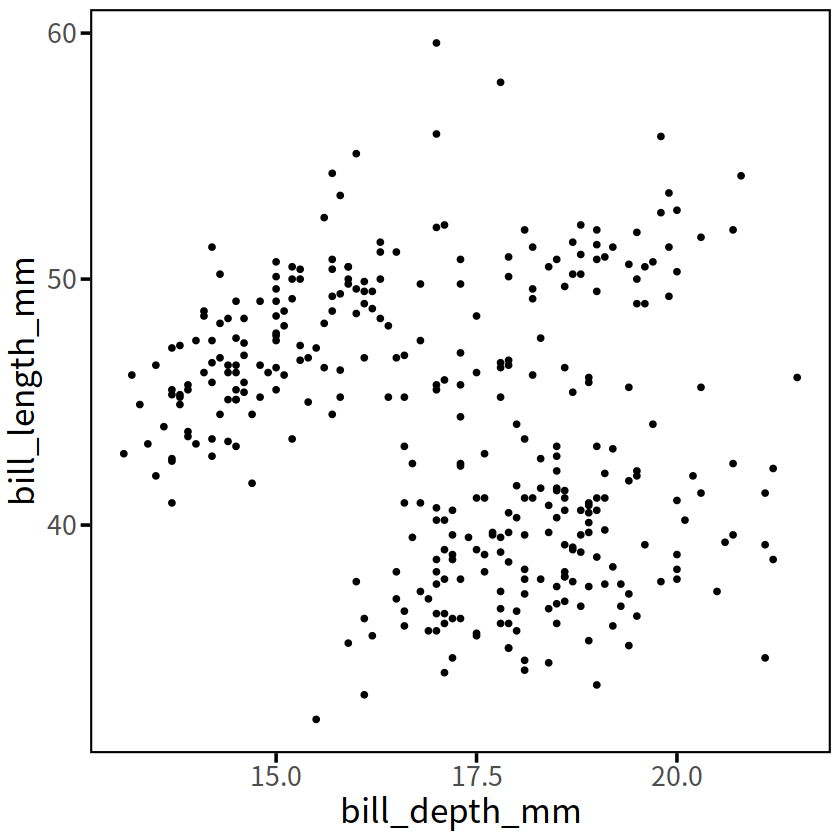
penguins %>%
  ggplot(aes(x = bill_depth_mm, y = bill_length_mm))+
  geom_point()+
  theme_bw()+
  theme(text = element_text(family = "serif", size = 20),
        panel.grid = element_blank(),
        panel.border = element_rect(color = "black", size = 1.2),
        axis.ticks = element_line(size = 1, color = "black"),
        axis.ticks.length = unit(2, "mm"))
Warning message:
“Removed 2 rows containing missing values or values outside the scale range (`geom_point()`).”
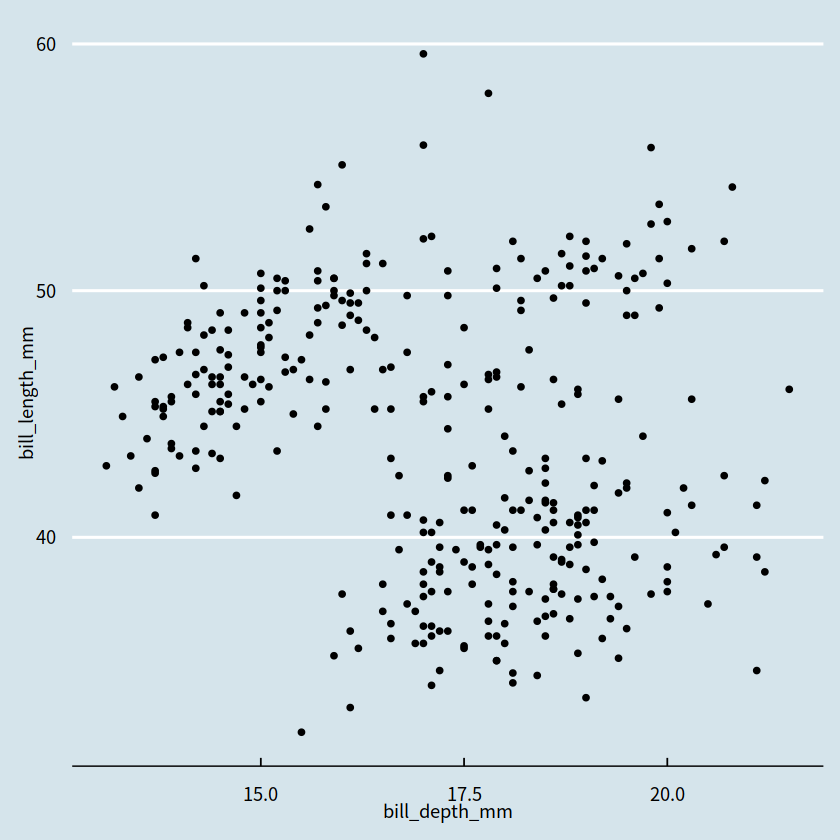
当然,ggthemes宏包也提供了很多优秀的主题风格
# install.packages("ggthemes")
library(ggthemes)
penguins %>%
  ggplot(aes(x = bill_depth_mm, y = bill_length_mm))+
  geom_point()+
  ggthemes::theme_economist()
Warning message:
“Removed 2 rows containing missing values or values outside the scale range (`geom_point()`).”
gapdata <- read_csv("./demo_data/gapminder.csv")
Rows: 1704 Columns: 6
── Column specification ─────────────────────────────────────────────────────────────────────────────────────────────────────────────────────────────────────────────────────────
Delimiter: ","
chr (2): country, continent
dbl (4): year, lifeExp, pop, gdpPercap
ℹ Use `spec()` to retrieve the full column specification for this data.
ℹ Specify the column types or set `show_col_types = FALSE` to quiet this message.
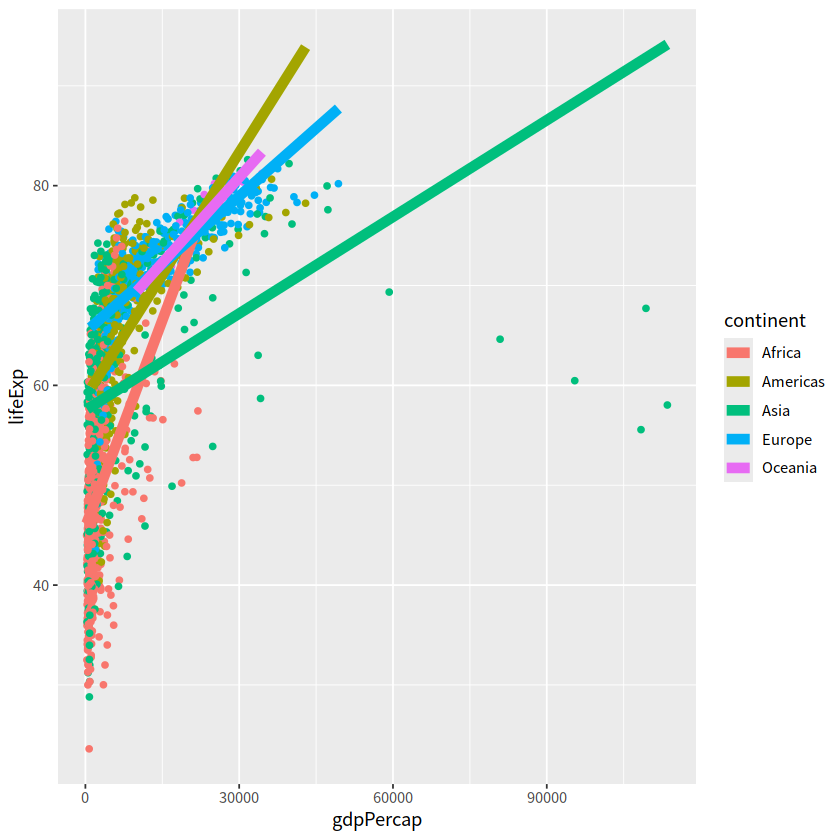
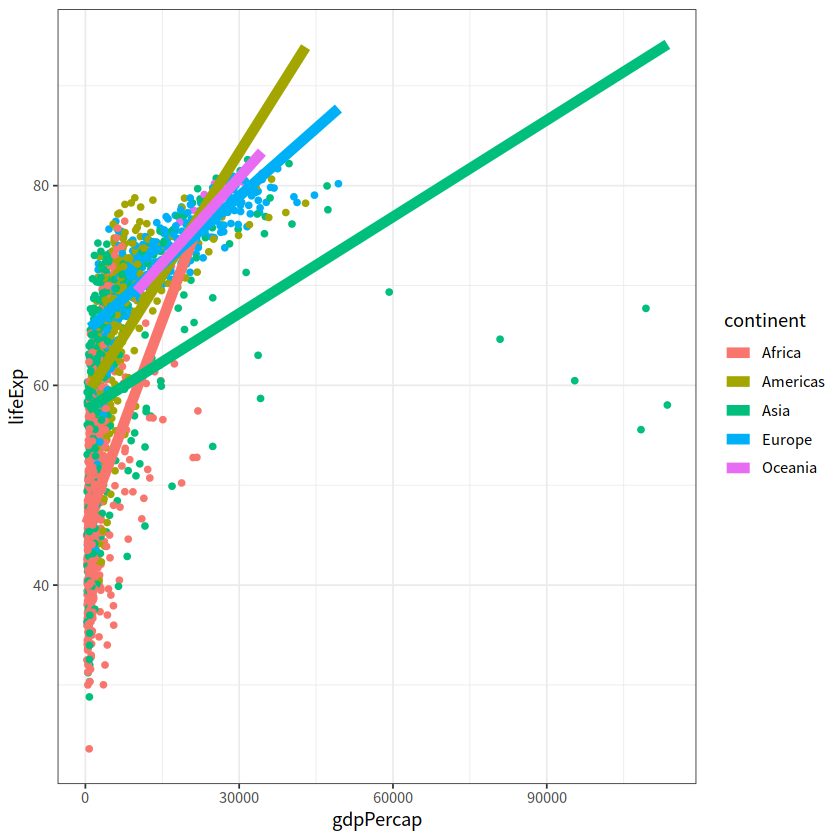
gapdata %>%
  ggplot(aes(x = gdpPercap, y = lifeExp, color = continent))+
  geom_point()+
  geom_smooth(lwd = 3, se = FALSE, method = "lm")+
  theme_grey() # 默认为这个
`geom_smooth()` using formula = 'y ~ x'
gapdata %>%
  ggplot(aes(x = gdpPercap, y = lifeExp, color = continent)) +
  geom_point() +
  geom_smooth(lwd = 3, se = FALSE, method = "lm") +
  theme_bw()
`geom_smooth()` using formula = 'y ~ x'
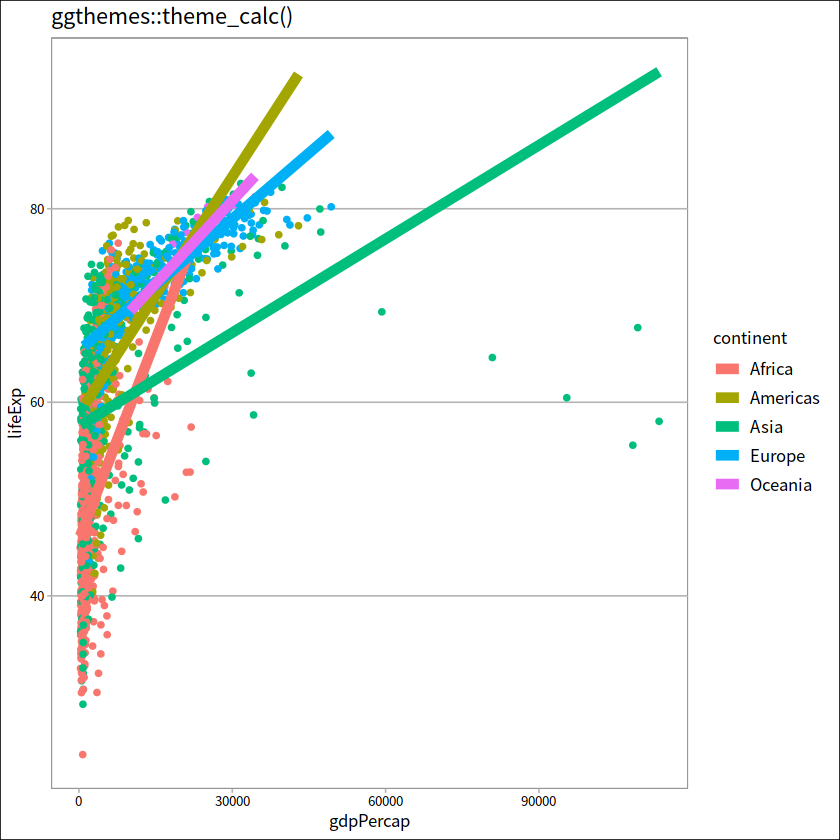
gapdata %>%
  ggplot(aes(x = gdpPercap, y = lifeExp, color = continent)) +
  geom_point() +
  geom_smooth(lwd = 3, se = FALSE, method = "lm") +
  ggthemes::theme_calc()+
  ggtitle("ggthemes::theme_calc()")
`geom_smooth()` using formula = 'y ~ x'
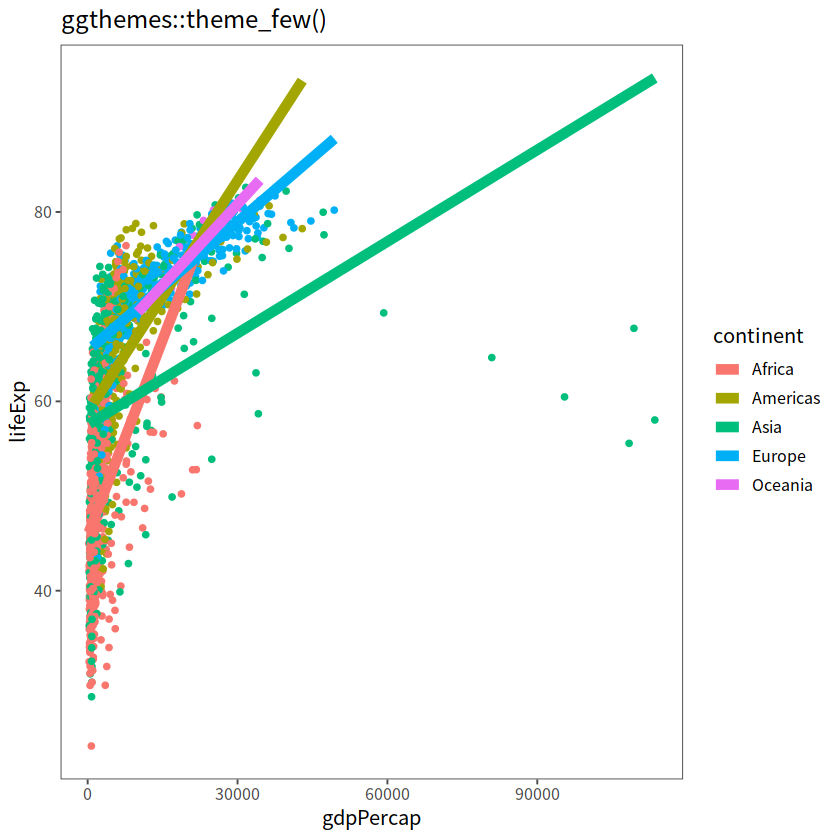
gapdata %>%
  ggplot(aes(x = gdpPercap, y = lifeExp, color = continent)) +
  geom_point() +
  geom_smooth(lwd = 3, se = FALSE, method = "lm") +
  ggthemes::theme_few()+
  ggtitle("ggthemes::theme_few()")
`geom_smooth()` using formula = 'y ~ x'
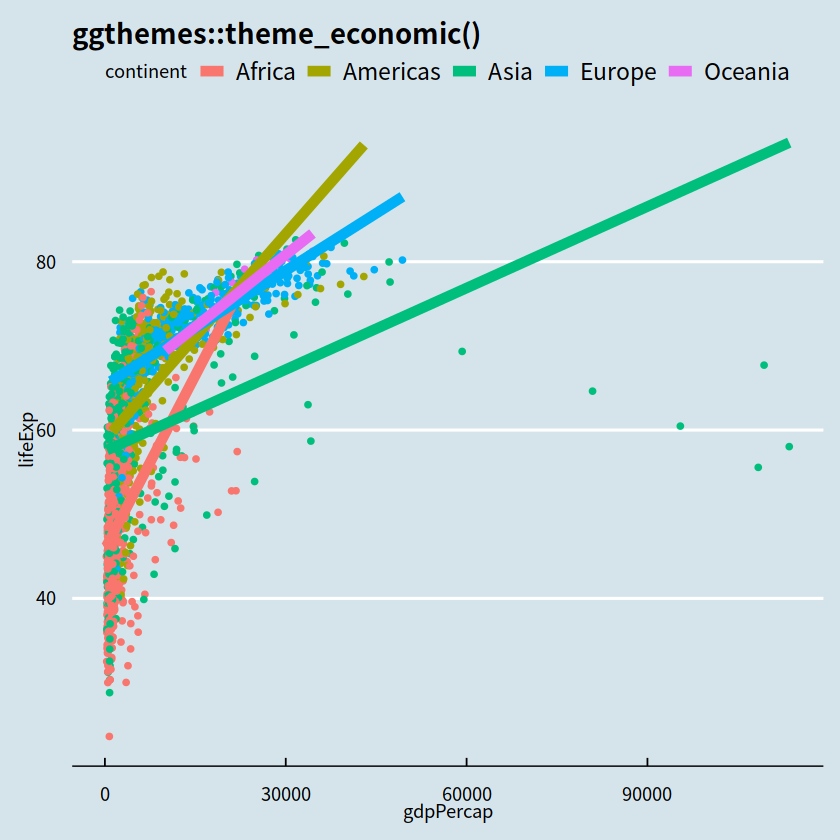
gapdata %>%
  ggplot(aes(x = gdpPercap, y = lifeExp, color = continent)) +
  geom_point() +
  geom_smooth(lwd = 3, se = FALSE, method = "lm") +
  ggthemes::theme_economist()+
  ggtitle("ggthemes::theme_economic()")
`geom_smooth()` using formula = 'y ~ x'
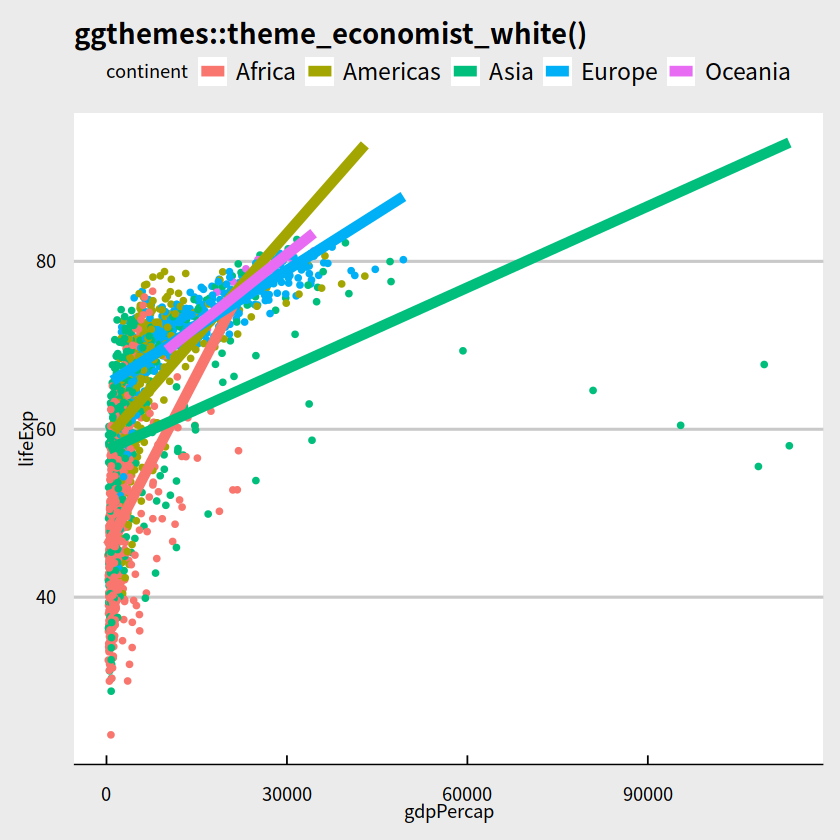
gapdata %>%
  ggplot(aes(x = gdpPercap, y = lifeExp, color = continent)) +
  geom_point() +
  geom_smooth(lwd = 3, se = FALSE, method = "lm") +
  ggthemes::theme_economist_white()+
  ggtitle("ggthemes::theme_economist_white()")
`geom_smooth()` using formula = 'y ~ x'
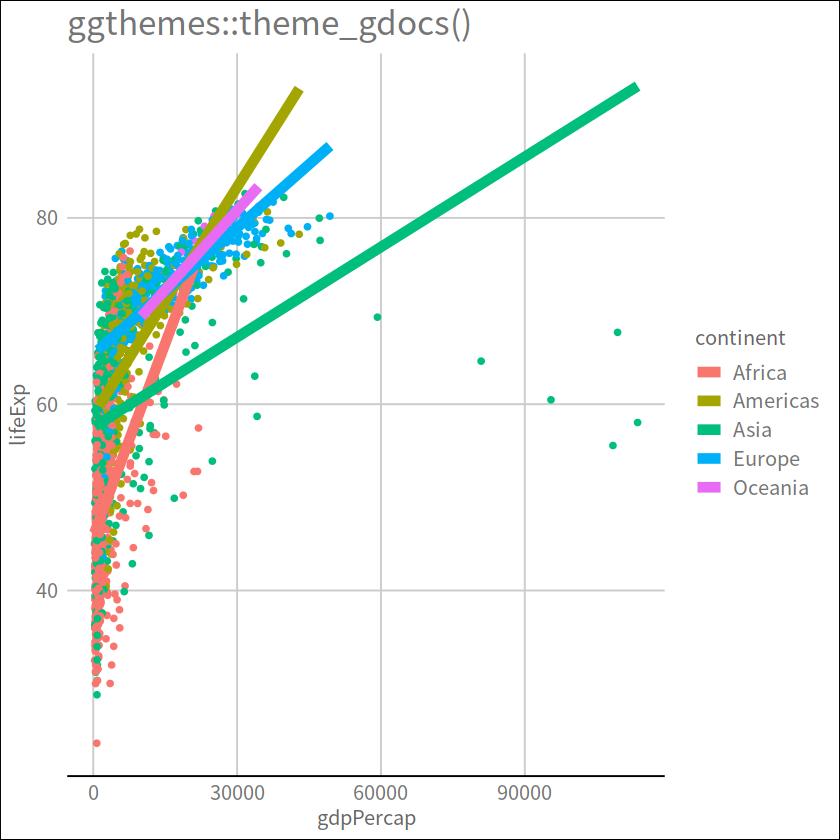
gapdata %>%
  ggplot(aes(x = gdpPercap, y = lifeExp, color = continent)) +
  geom_point() +
  geom_smooth(lwd = 3, se = FALSE, method = "lm") +
  ggthemes::theme_gdocs()+
  ggtitle("ggthemes::theme_gdocs()")
`geom_smooth()` using formula = 'y ~ x'
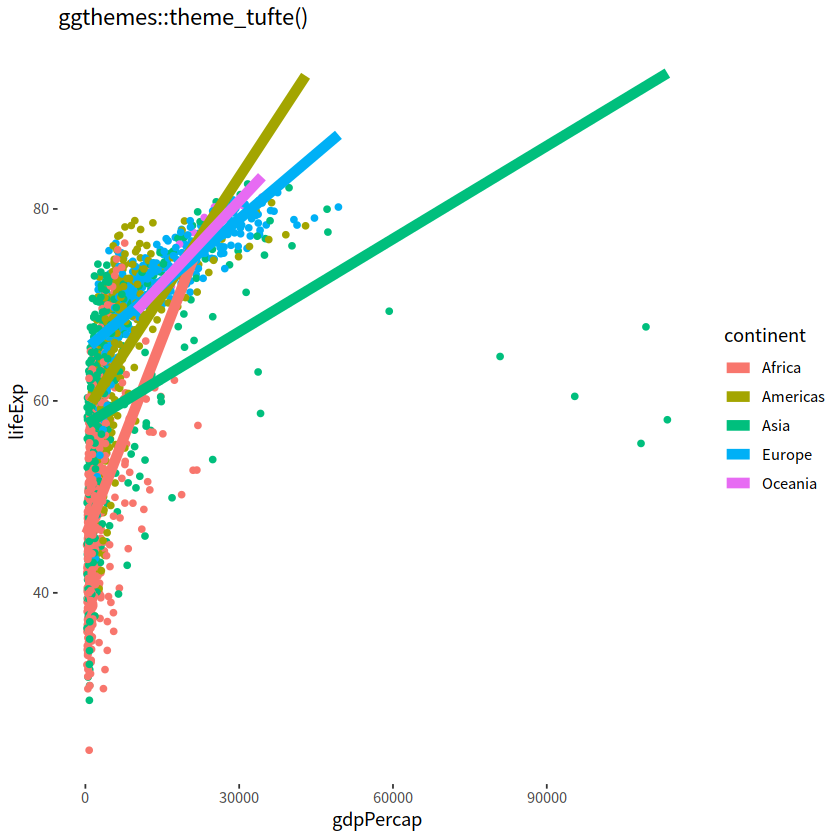
gapdata %>%
  ggplot(aes(x = gdpPercap, y = lifeExp, color = continent)) +
  geom_point() +
  geom_smooth(lwd = 3, se = FALSE, method = "lm") +
  ggthemes::theme_tufte()+
  ggtitle("ggthemes::theme_tufte()")
`geom_smooth()` using formula = 'y ~ x'
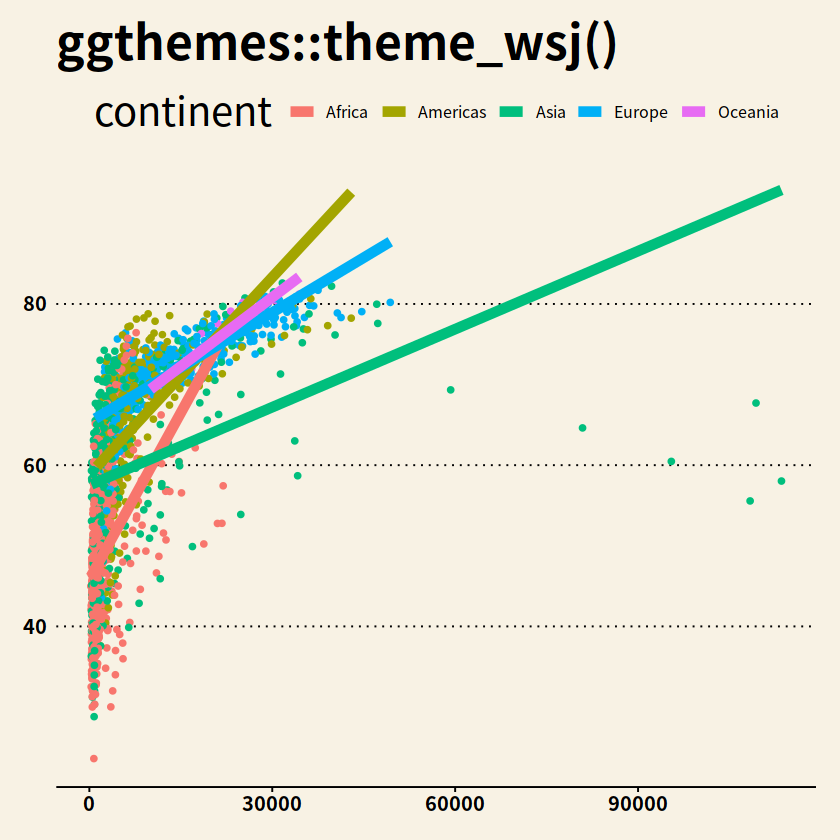
gapdata %>%
  ggplot(aes(x = gdpPercap, y = lifeExp, color = continent)) +
  geom_point() +
  geom_smooth(lwd = 3, se = FALSE, method = "lm") +
  ggthemes::theme_wsj()+
  ggtitle("ggthemes::theme_wsj()")
`geom_smooth()` using formula = 'y ~ x'