ggplot进阶之图例系统#
library(tidyverse)
── Attaching core tidyverse packages ───────────────────────────────────────────────────────────────────────────────────────────────────────────────────────── tidyverse 2.0.0 ──
✔ dplyr     1.1.4     ✔ readr     2.1.5
✔ forcats   1.0.0     ✔ stringr   1.5.1
✔ ggplot2   3.5.0     ✔ tibble    3.2.1
✔ lubridate 1.9.3     ✔ tidyr     1.3.1
✔ purrr     1.0.2
── Conflicts ─────────────────────────────────────────────────────────────────────────────────────────────────────────────────────────────────────────── tidyverse_conflicts() ──
✖ dplyr::filter() masks stats::filter()
✖ dplyr::lag()    masks stats::lag()
ℹ Use the conflicted package (<http://conflicted.r-lib.org/>) to force all conflicts to become errors
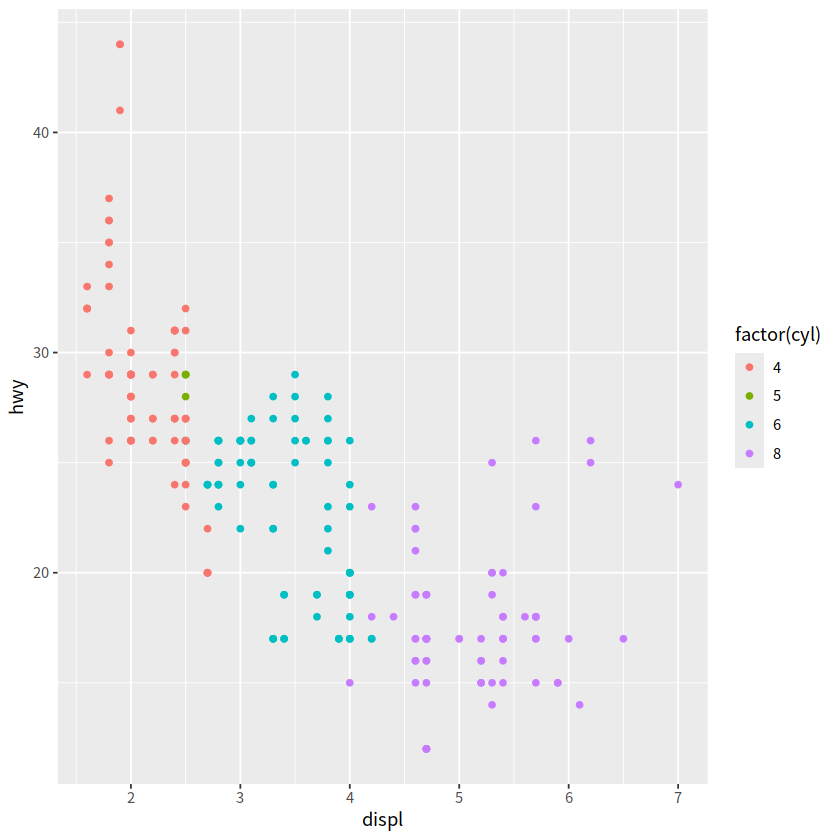
mpg %>%
  ggplot(aes(x = displ, y = hwy, color = factor(cyl)))+
  geom_point()
如果想调整图例的样式,可以使用guides()函数,用法类似theme函数, 具体参数为:
要么是字符串 (i.e.
"color = colorbar"or"color = legend"),要么是特定的函数 (i.e.
color = guide_colourbar()orcolor = guide_legend())
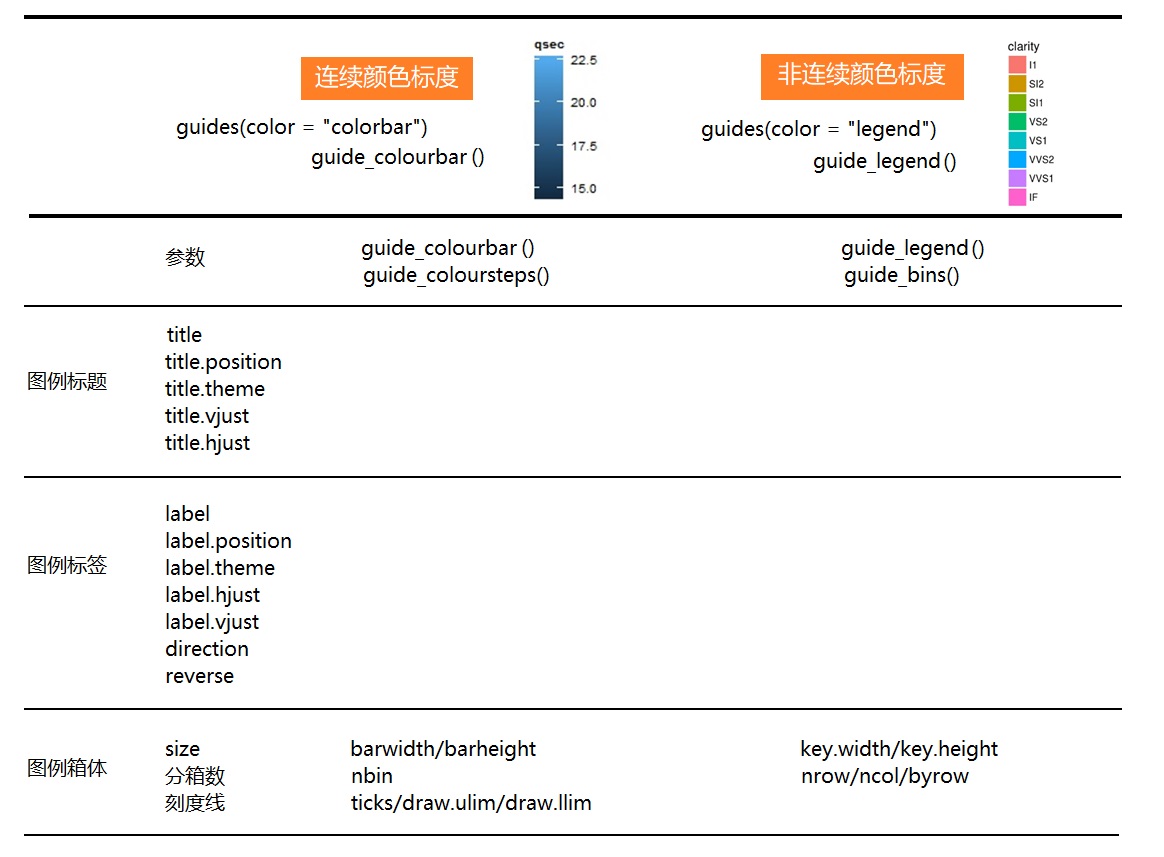
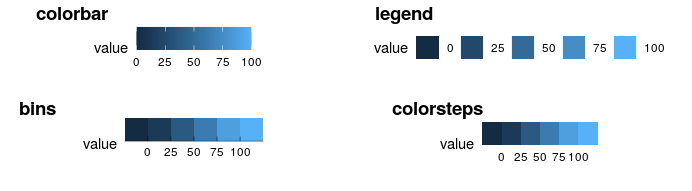
以下 guides() 函数族用于控制图例的外观
guide_colorbar(): continuous colorsguide_legend(): discrete values (shapes, colors)guide_axis(): control axis text/spacing, add a secondary axisguide_bins(): creates “bins” of values in the legendguide_colorsteps(): makes colorbar discrete
2 案例详解#
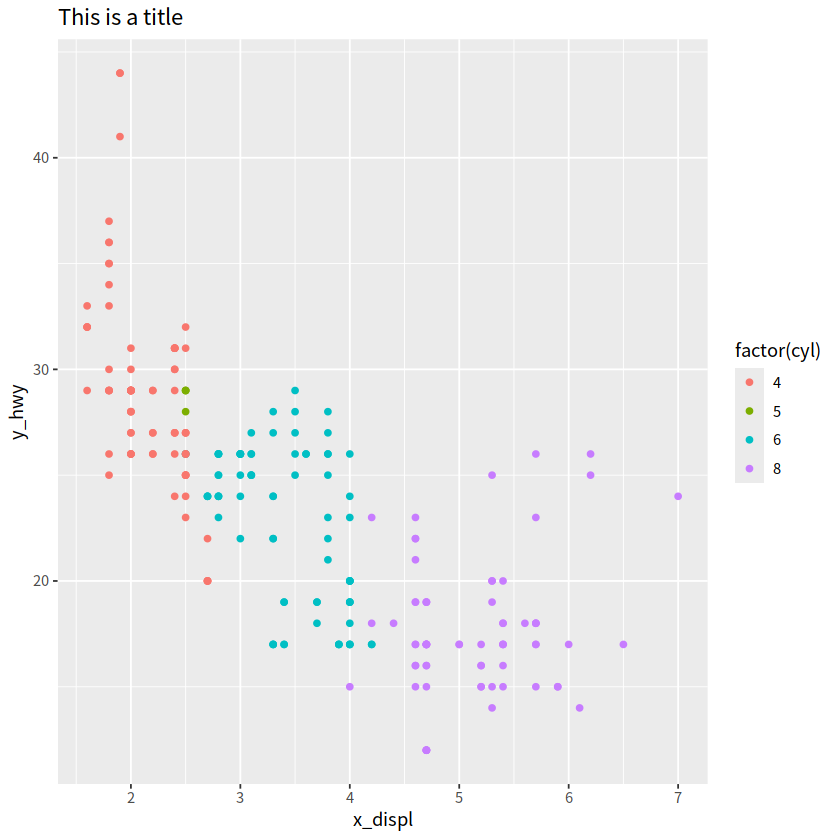
mpg %>%
  ggplot(aes(x = displ, y = hwy, color = factor(cyl)))+
  geom_point()+
  ggtitle("This is a title")+
  labs(x = "x_displ", y = "y_hwy")+
  guides(color = "legend")
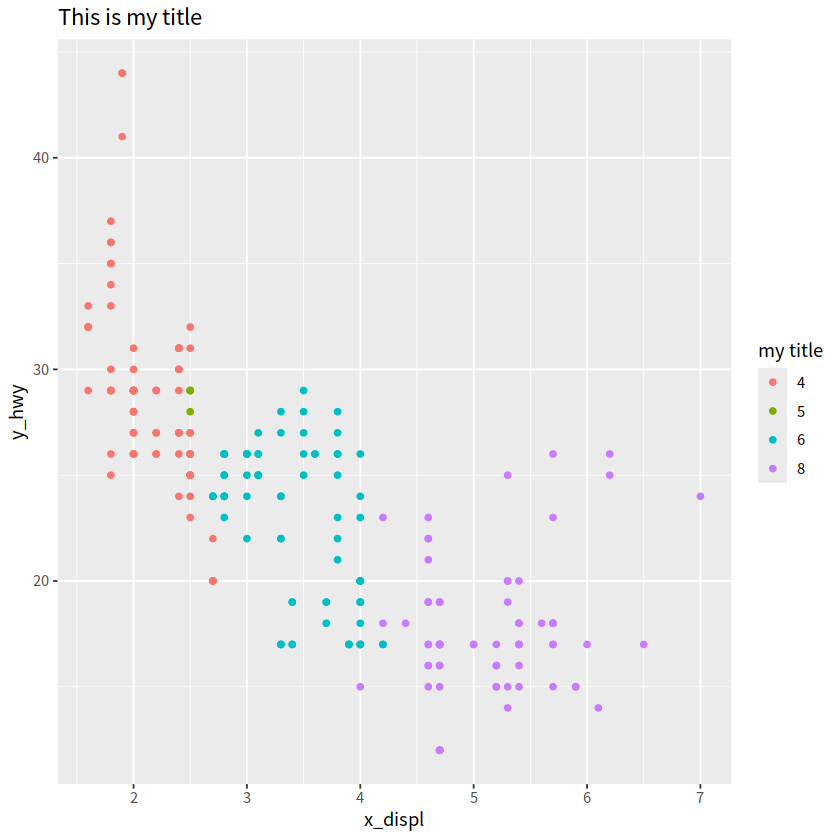
mpg %>%
  ggplot(aes(x = displ, y = hwy, color = factor(cyl))) +
  geom_point() +
  ggtitle("This is my title") +
  labs(x = "x_displ", y = "y_hwy") +
  guides(color = guide_legend(title = "my title",
                              label.hjust = 1))
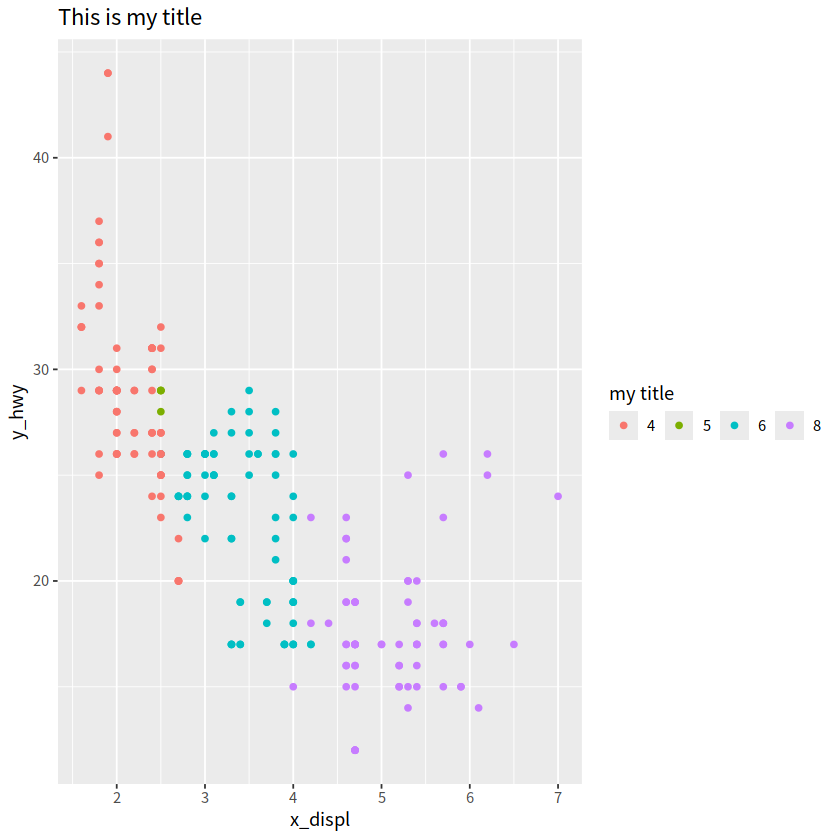
mpg %>%
  ggplot(aes(x = displ, y = hwy, color = factor(cyl))) +
  geom_point() +
  ggtitle("This is my title")  +
  labs(x = "x_displ", y = "y_hwy") +
  guides(color = guide_legend(ncol = 4,
                              title = "my title"))
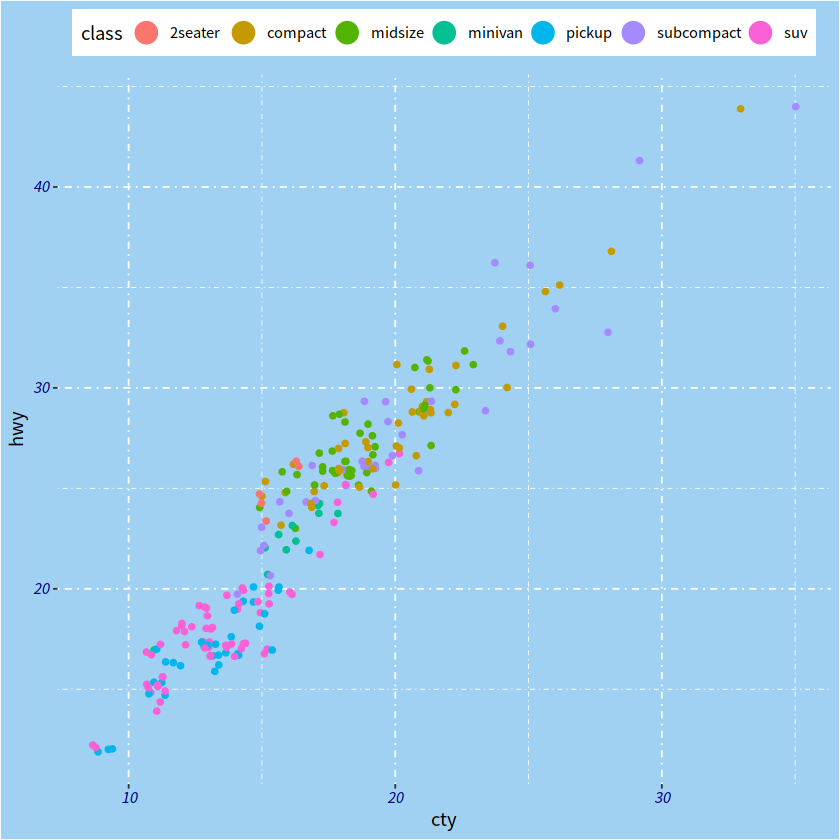
mpg %>%
  ggplot() +
  geom_jitter(aes(x = cty, y = hwy, color = class),
              key_glyph = draw_key_pointrange)+
  guides(color = guide_legend(nrow = 1))+
  theme(legend.position = "top",
        axis.text = element_text(face = "italic", color = "navy"),
        plot.background = element_rect(fill = "#a0d1f2"),
        panel.background = element_blank(),
        panel.grid = element_line(linetype = "dotdash"))
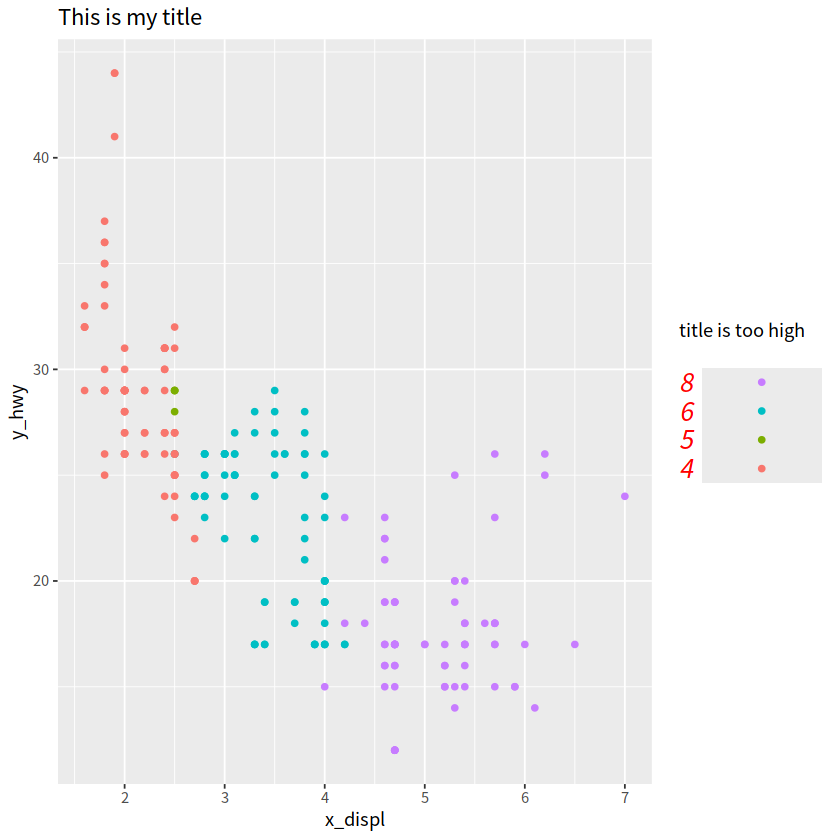
mpg %>%
  ggplot(aes(x = displ, y = hwy, color = factor(cyl))) +
  geom_point() +
  ggtitle("This is my title")  +
  labs(x = "x_displ", y = "y_hwy") +
  guides(color = guide_legend(title = "title is too high",
                              title.position = "top",
                              title.vjust = 5,
                              label.position = "left",
                              label.hjust = 1,
                              label.theme = element_text(size = 15, angle = 0,
                                                         face = "italic",color = "red"),
                              keywidth = 5,
                              reverse = TRUE))
3 删除其中一个图例#
guides(color = "none)
guides(color = guide_none())
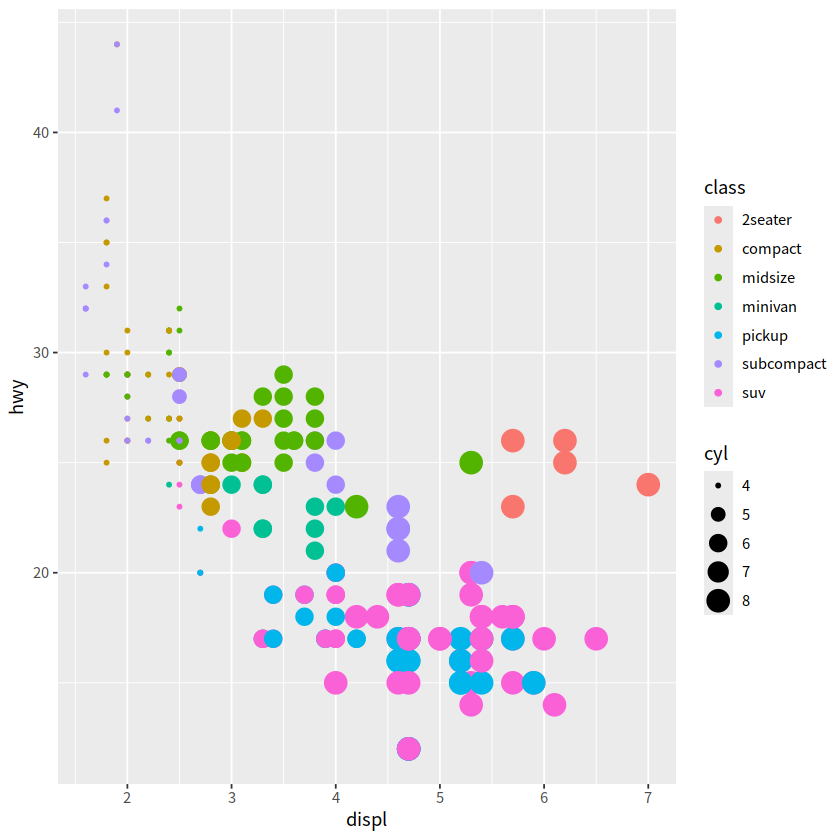
mpg %>%
  ggplot(aes(x = displ, y = hwy, color = class, size = cyl))+
  geom_point()
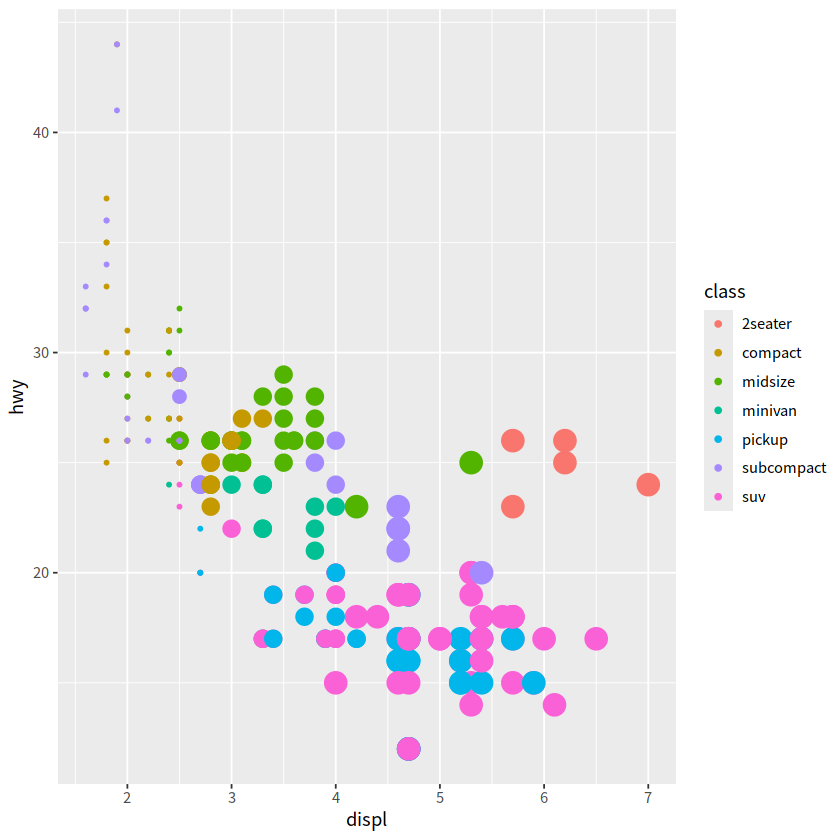
比如,我们想删除size这个图例,那么需要这样做
mpg %>%
  ggplot(aes(x = displ, y = hwy, color = class, size = cyl))+
  geom_point()+
  guides(color = guide_legend("type"),  # keep
         size = "none")                 # remove

mpg %>%
  ggplot(aes(x = displ, y = hwy, color = class, size = cyl))+
  geom_point()+
  guides(color = guide_legend("class"),  # keep
         size = "none")                 # remove

或者
mpg %>%
  ggplot(aes(x = displ, y = hwy, color = class, size = cyl)) +
  geom_point() +
  guides(color = guide_legend("type"),
         size = guide_none())
4 合并图例#
library(tidyverse)
library(palmerpenguins)

penguins %>%
  ggplot(aes(x = bill_length_mm, y = bill_depth_mm,
             color = body_mass_g, size = body_mass_g))+
  geom_point(alpha = 0.6)+
  scale_color_viridis_c()
Warning message:
“Removed 2 rows containing missing values or values outside the scale range (`geom_point()`).”
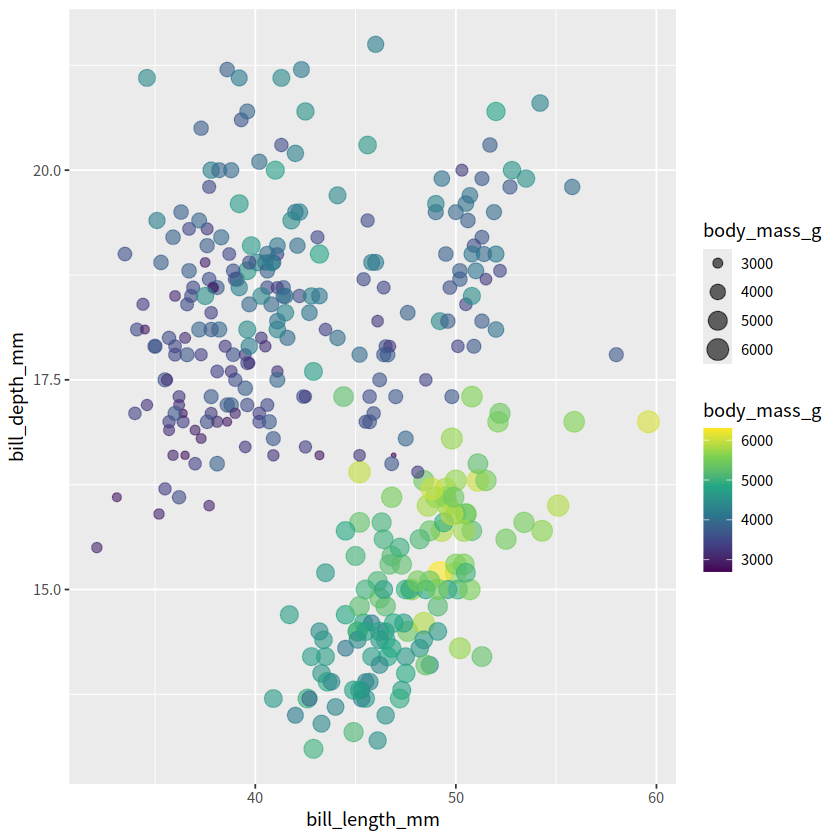
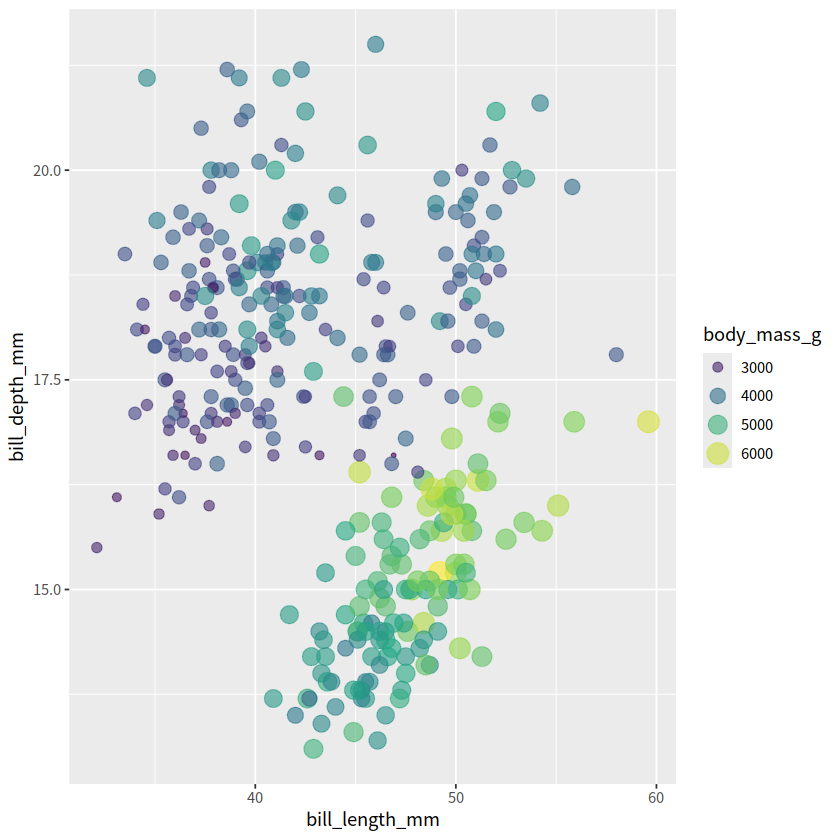
这里color 和 size 都使用了body_mass_g映射,我们可以将两者合并
penguins %>%
  ggplot(aes(x = bill_length_mm, y = bill_depth_mm,
             color = body_mass_g, size = body_mass_g))+
  geom_point(alpha = 0.6)+
  scale_color_viridis_c()+
  guides(color = guide_legend())
Warning message:
“Removed 2 rows containing missing values or values outside the scale range (`geom_point()`).”
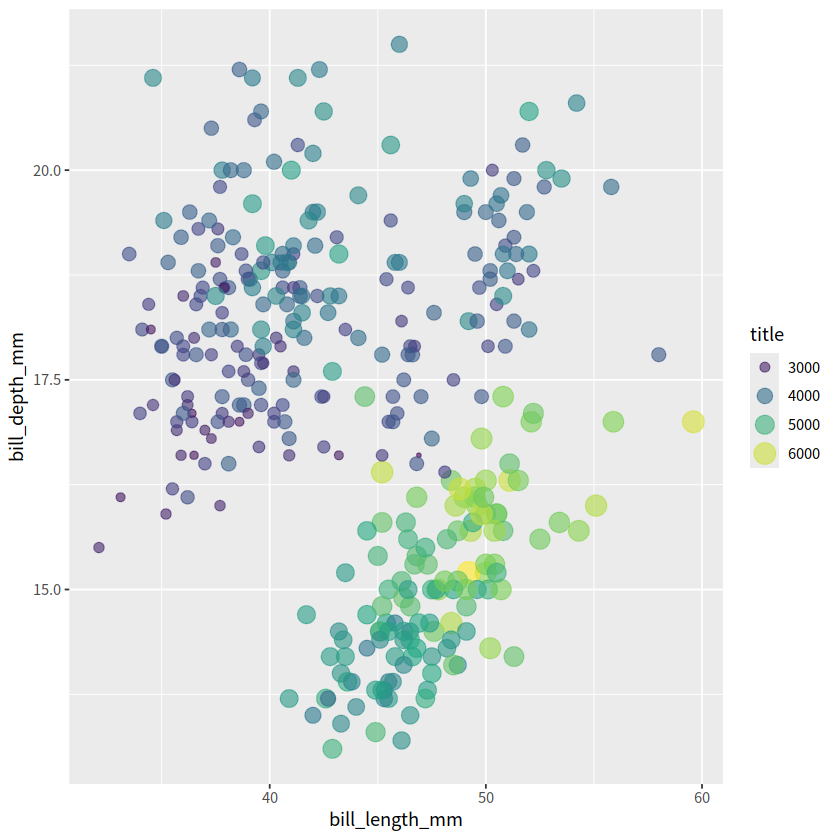
更直观的方法
penguins %>%
  ggplot(aes(x = bill_length_mm, y = bill_depth_mm,
             color = body_mass_g, size = body_mass_g))+
  geom_point(alpha = 0.6)+
  scale_color_viridis_c()+
  guides(color = guide_legend(),
         size  = guide_legend())
Warning message:
“Removed 2 rows containing missing values or values outside the scale range (`geom_point()`).”
或者
penguins %>%
  ggplot(aes(x = bill_length_mm, y = bill_depth_mm,
             color = body_mass_g, size = body_mass_g))+
  geom_point(alpha = 0.6)+
  scale_color_viridis_c()+
  guides(color = guide_legend("title"),
         size  = guide_legend("title"))
Warning message:
“Removed 2 rows containing missing values or values outside the scale range (`geom_point()`).”
最省力的是
penguins %>%
  ggplot(aes(x = bill_length_mm, y = bill_depth_mm,
             color = body_mass_g, size = body_mass_g))+
  geom_point(alpha = 0.6)+
  scale_color_viridis_c(guide = "legend")
Warning message:
“Removed 2 rows containing missing values or values outside the scale range (`geom_point()`).”
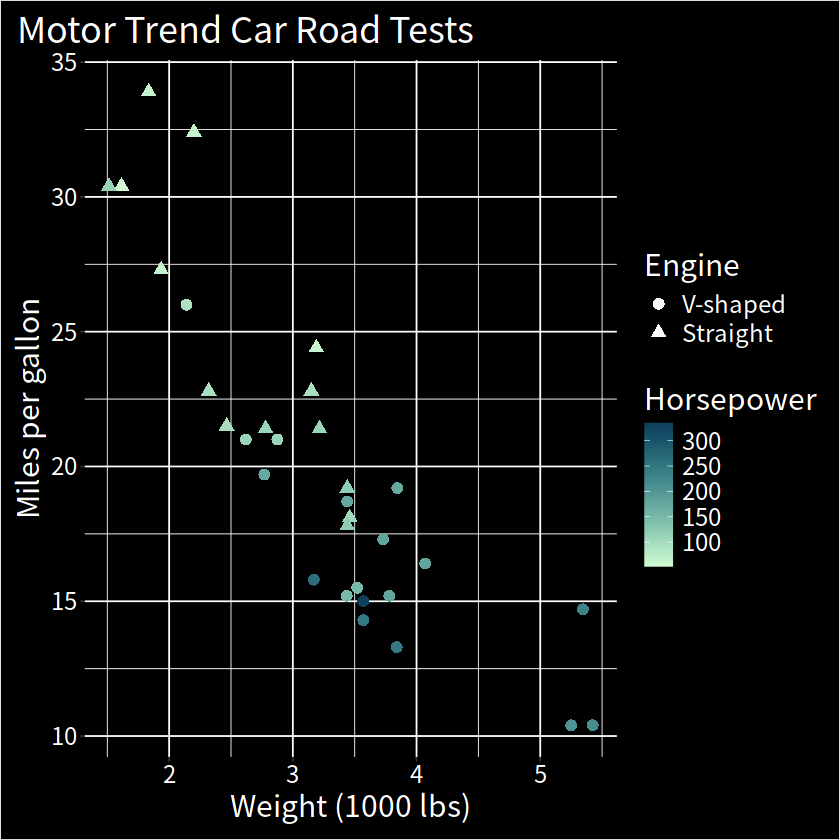
mtcars %>%
  as_tibble() %>%
  ggplot(aes(x = wt, y = mpg, shape = factor(vs), color = hp)) +
  geom_point(size = 3) +
  colorspace::scale_color_continuous_sequential(palette = "Dark Mint") +
  scale_shape_discrete(labels = c("V-shaped", "Straight")) +
  labs(
    x = "Weight (1000 lbs)", y = "Miles per gallon",
    title = "Motor Trend Car Road Tests",
    shape = "Engine", color = "Horsepower"
  ) +
  theme(
    text = element_text(size = 18, color = "white"),
    rect = element_rect(fill = "black"),
    panel.background = element_rect(fill = "black"),
    legend.key = element_rect(fill = "black"),
    axis.text = element_text(color = "white"),
    plot.title.position = "plot",
    plot.margin = margin(10, 10, 10, 10)
  ) +
  guides(
    shape =
      guide_legend(override.aes = list(color = "white"))
  )